|
"Bad news goes about in clogs, good
news in stockinged feet." Welsh
Proverb. And
we certainly saw both good and bad news in the economic
reports released
last week. Here are the details...and what they mean for home
loan rates.
 On
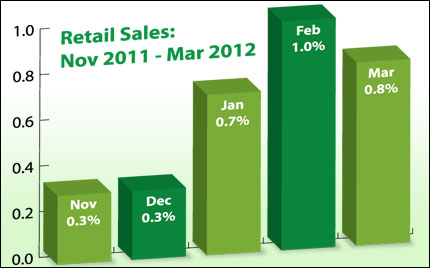
the good side, Retail Sales in March On
the good side, Retail Sales in March
rose by a nice 0.8%, as consumers
bought all kinds of products across the
board. And when stripping out
autos,
sales still grew. This adds to the increasing
trend seen in January
and February and
is a good sign for our economy, as
consumers don't spend
when they aren't
feeling optimistic about their financial situation.
But over in the manufacturing sector it
was
not as pretty a picture, as both the Empire
State Manufacturing Index
and the Philly
Fed Index came in below expectations. This is largely being
attributed to a global
slowdown, and experts say that the outlook for our
manufacturing remains positive…
but just not accelerating at the present
time. Things weren't as pretty in the
housing sector either, as both
Existing Home Sales and Housing Starts fell in March.
And things in the labor market were
verging on ugly, as Initial Jobless Claims
spiked sharply higher. The Labor
Department reported 386,000 fresh Claims
in the latest week, above the
375,000 that was expected...and well above the
350,000 range seen in recent
weeks.
Also verging on ugly was news out of Europe.
There is growing and very justified
concern about Spain's ability to pay
down debt, meet new budget deficit
targets, and avoid a bailout or debt
restructuring. The Spanish situation
has prompted the G-20 (Finance
Ministers and Central Bankers of the 20
largest economies) to urge the
European Central Bank to do more to contain
their debt crisis as it
threatens global growth. And let's not forget that besides
Spain, we still
have France, Portugal, Ireland and Greece to deal with in future
months and
years.
So what does all of this mean
for Bonds and home loan rates? There will l
ikely be more
safe haven trading into the relative safety of the US Dollar and
US Bonds
(which will benefit Mortgage Bonds, to which home loan rates are
tied) as
the uncertainty out of Europe escalates. And more bad economic
reports here
in the United States could add to this safe haven trading into
our Bonds,
just as more good economic news here would likely benefit Stocks
at the
expense of our Bonds and home loan rates.
This mix of factors will
continue to impact the direction in which Bonds
and home loan rates move in
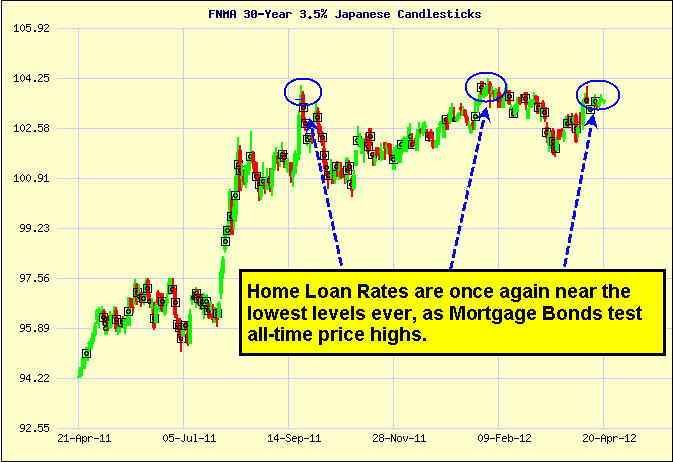
the weeks ahead. The takeaway is that
home loan rates remain near historic
lows and now continues to be a
great time to purchase or refinance a home.
Let me know if I can answer
any questions at all for you or your clients.
|


No comments:
Post a Comment