Sunday, October 7, 2012

What the Job Reports really mean

In This Issue

Last Week in Review: The Jobs Report for September was released. What do the numbers really mean?
Forecast for the Week: A holiday-shortened week and a light economic calendar are ahead.
View: Check out this easy way to explain the impact of inflation on home loan rates to your clients.
Last Week in Review

Read between the lines. Last week, the Jobs Report for September was released, but the numbers may not be as clear as they seem. Read on for details and what they mean for home loan rates.
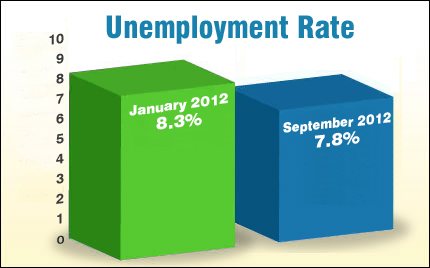
The Labor Department’s Jobs Report showed that 114,000 new jobs were created in September, with 104,000 private sector job gains and 10,000 government job gains. While this number was lower than expectations, the job numbers for July and August were revised much higher.
But perhaps the biggest news in the report is that the unemployment rate came in at 7.8%, falling by a whopping 0.3% from August’s 8.1% reading. This represents the lowest unemployment rate since January 2009. And while that is good news, it’s even more important to look at the Labor Force Participation Rate (LFPR).
The LFPR did improve by 0.1% to 63.6%, but it remains near thirty-one year lows! The LFPR calculation is quite simple. If you are 16 years old and not in the military, then you either have a job or not. The ratio of people "participating" or working is then compared to the total population.
On balance, September’s Jobs Report confirms that our economy is producing 125,000 to 140,000 jobs per month. While that may sound good, those numbers are not high enough to keep up with immigration and population growth. The ongoing weakness in the labor market is one of the major reasons why the Fed announced another round of Bond buying (known as Quantitative Easing or QE3) on September 13, saying they will provide this stimulus to our economy until the labor market is well into recovery.
So what does all of this mean for home loan rates? Another reason the Fed enacted QE3—and they are buying such large amounts of Mortgage Bonds each month—is to keep home loan rates (which are tied to Mortgage Bonds) near record lows. The Fed hopes this will help strengthen our housing market and economy overall. However, as the labor market and economy start to improve and if inflation heats up, Bonds could face some selling pressure…which could impact home loan rates negatively as a result.
The bottom line is that now is a great time to consider a home purchase or refinance, as home loan rates remain near historic lows. Let me know if I can answer any questions at all for you or your clients.
Forecast for the Week

Chart: Fannie Mae 3.0% Mortgage Bond (Friday Oct 05, 2012)
Japanese Candlestick Chart
The credit markets are closed on Monday in observance of Columbus Day, and the week features a light economic calendar after that.
  • The Fed’s Beige Book will be released on Wednesday. The Beige Book contains anecdotal information on the current economic and business conditions from the various regional Federal Reserve Banks across the country.
  • Thursday brings another weekly Initial Jobless Claims Report. Last week, claims rose from a two-month low as the labor market is still trying to dig its way out of a hole.
  • On Friday, we’ll see how inflation is doing at the wholesale level with the Producer Price Index. Plus, the Consumer Sentiment Report will be delivered.
In addition, earnings season kicks off this week and this could impact trading—and in turn, impact the path of home loan rates.
Remember: Weak economic news normally causes money to flow out of Stocks and into Bonds, helping Bonds and home loan rates improve, while strong economic news normally has the opposite result. The chart below shows Mortgage Backed Securities (MBS), which are the type of Bond that home loan rates are based on.
When you see these Bond prices moving higher, it means home loan rates are improving — and when they are moving lower, home loan rates are getting worse.
To go one step further — a red “candle” means that MBS worsened during the day, while a green “candle” means MBS improved during the day. Depending on how dramatic the changes were on any given day, this can cause rate changes throughout the day, as well as on the rate sheets we start with each morning.
As you can see in the chart below, Bonds prices worsened last week after some better than expected manufacturing and other economic data. However, home loan rates remain near record lows and I’ll be watching closely to see what happens this week.
The Mortgage Market Guide View...

A Simple Story:
How to Explain the Impact of Inflation on Home Loan Rates
In the wake of the Fed’s QE3 (or Quantitative Easing) announcement, consumers may be wondering how this new effort to stimulate the economy may impact the mortgage and housing markets.
And they’d be right to wonder.
That’s because one of the consequences of QE3 could be inflation—which is the archenemy of Bonds and home loan rates.
Here’s a narrative you can use to explain to your clients why this is important…
Imagine for a moment that you are going to lend your very own money to someone to buy a house. So you go through all the paces to determine this person is a good credit risk, you do the loan, and you start receiving $1,500 per month as your regular payment. You then of course take that $1,500 and start loading up your shopping cart with the goods and services you need on a monthly basis...food, clothing, medicine, gas, and so on.
But over time, you notice something happening…
Every month, you are getting slightly less in your cart than you did the month before, for that same $1,500 you are spending. Why? Because costs are on the rise–that's inflation.
Now imagine that you are once again going to lend your very own money to another person to buy a house. You go through all the paces once again, and determine that the person is a good credit risk.
You want the same shopping cart full of "stuff" that you got last time in return for doing the loan, but this time you realize that you can no longer get that same cart full with $1,500. Due to inflation, you now need $1,700 to buy those same goods and services.
As a result, you will need to charge a higher interest rate to compensate you for the ongoing impact of inflation. This is why home loan rates change when there is a fear of inflation in the air.
Economic Calendar for the Week of October 08 - October 12
Date
ET
Economic Report
For
Estimate
Actual
Prior
Impact
Wed. October 10
02:00
Beige Book
Sept


Moderate
Thu. October 11
08:30
Jobless Claims (Initial)
10/6
NA
 
NA
Moderate
Fri. October 12
08:30
Producer Price Index (PPI)
Sept
NA
 
1.7%
Moderate
Fri. October 12
08:30
Core Producer Price Index (PPI)
Sept
NA
 
0.2%
Moderate
Fri. October 12
10:00
Consumer Sentiment Index (UoM)
Oct
NA
 
78.3
Moderate

The material contained in this newsletter is provided by a third party to real estate, financial services and other professionals only for their use and the use of their clients. The material provided is for informational and educational purposes only and should not be construed as investment and/or mortgage advice. Although the material is deemed to be accurate and reliable, we do not make any representations as to its accuracy or completeness and as a result, there is no guarantee it is without errors.

As your mortgage professional, I am sending you the MMG WEEKLY because I am committed to keeping you updated on the economic events that impact interest rates and how they may affect you.

Mortgage Success Source, LLC is the copyright owner or licensee of the content and/or information in this email, unless otherwise indicated.   Mortgage Success Source, LLC does not grant to you a license to any content, features or materials in this email.   You may not distribute, download, or save a copy of any of the content or screens except as otherwise provided in our Terms and Conditions of Membership, for any purpose.
Equal Housing Lender    

No comments:

Post a Comment